|
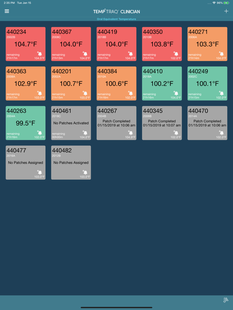
Real-time temperatures are displayed along with temperature graphs (above) displaying temperatures recorded by the TempTraq patch. Live information is viewed through the TempTraq app on a patient's smartphone with the capability of streaming to a clinical team monitoring the patient remotely. GREEN values have been defined by the clinician as 'normal', ORANGE >38 degrees C, and RED is equal to, or higher than the 'alert' temperature set for the patient - providing visual and audio alerts to rising temperatures.
Remotely, (or at central nursing stations), clinicians are able to monitor groups of their patients simultaneously with real-time temperature displays and color coded alerts. |
In the graph above, we can see three rises in temperatures that the patient managed by taking Tylenol. Later in the recording when the patient began to experience 'symptoms', the patient could see their temperature 'rise' on the app, and was able to manage their fever with medication.


